This might sound ridiculous , but it’s actually not. You might also think I took a kick to the head when I tell you that tiny Costa Rica (not Germany) was number 1. Let me explain and you can decide.
The premise is simple. The quality of the teams entering a tournament can be ranked and measured by the transfer value (on the open market) of the players that are in its squad. Transfer Value is the one metric that the soccer world uses to determine quality. Yes it’s subjective and many players are over priced, but it is also the one unifying measurement tool all teams use to assess players with “hard cash” changing hands. Transfer Value is the Stock Exchange of the soccer world On paper (and in theory) the team with the “best” players should win the tournament. Again, not necessarily true but it’s a good starting point and benchmark to decide favorites and underdogs .
With this in mind SoccerBizUSA.com is introducing a new metric (That i know of) to highlight just how well the USA (and Concacaf Teams) performed
“Transfer Value Performance Index” © TVPI.
Formula
Transfer Value Rank entering Tournament MINUS Final Position = “TVPI”
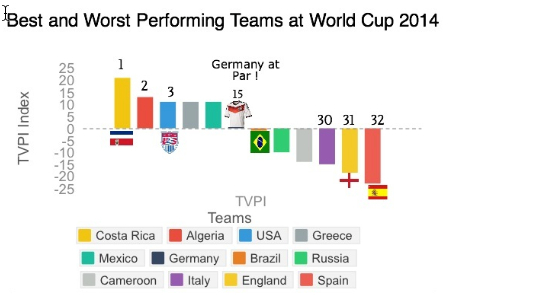
Now clearly the USA was not the 3rd best team in Brazil , but the above represents a plausible argument for saying they were the 3rd best* “over-performing” team in the tournament . It also shows American fans (in a quantifiable way) just how much of an underdog the USA were going in and as such how more impressive making the last 16 was.
Example
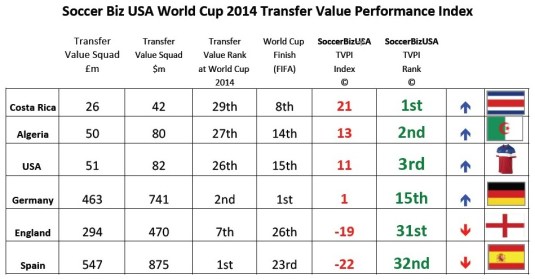
Player for player Spain were the “best team” entering the tournament, yet finished last with a TVPI of -22 woefully underperforming . Followed very closely by England and Italy. Costa Rica entered 29th in “value” yet finished 8th giving them a positive TVPI of +21), making it the number one “over performing” team Brazil. (Which would be hard to argue with) .
Germany the actual winners and the true best team . entered ranked 2nd and finished 1st (TVPI = +1) As such they were expected to do well and did. Sound familiar!.
The USA entered the Tournament ranked 26th in squad transfer value , (at just $82m) . They finished a very credible 15th giving then a TVPI of +11 and overall 3rd best score * . And why not ?. They escaped the “Group of Death” and never had one “easy” game. Sure, on any given day Belgium could have scored 5 and Germany the same, but the reality is they didn’t. (The USA are not Brazil after all !! ) Equally, had Wondolowski scored when he should have , the USA would have been top 8. That’s soccer.
By any measure, whether it be heart and passion , guts and grit or “quantifiable” numbers, it is clear the USA “over- performed” in Brazil against quantifiably enormous odds. They and we should be proud of what was achieved.
You can agree or disagree with the premise but when you look at the hard numbers it was an incredible performance. It actually again becomes even more impressive again when you look behind the transfer value numbers….which I will highlight in my next blog and infograph in a few days.
Gary
Also huge Kudos to another Concacaf Team Mexico who finished joint 3rd with the USA in my rankings list. Exciting and enthralling to watch they had a horrendous qualification series but came up big when it mattered most. (Still can’t believe how they let the Holland game escape them)
Question ? Here’s a haunting question : “Why does the entire value of the USA squad only come to $82m?.
By my reckoning that means there was a $1.4b gap in the “quality” between the USA and the Teams they faced in Brazil. That’s a Billion by the way !!! (No wonder Tim Howard had to make 16 saves.) The simple truth is that heart and passion alone does not win a World Cup. ( If it did it might be touring the USA now.) Only teams bursting with recognized and tested World Class talent ultimately win World Cups . The reality is the USA is currently sadly short of any truly truly World Class talent. About $1.4b short to be precise.
Sign up to my Twitter and Blog for the next infograph…it will explain where the $1.4b comes from.

Leave a comment